In the rapidly evolving world of e-commerce, data-driven decision-making is no longer optional—it’s essential. For online businesses to thrive, understanding the health and direction of their performance metrics is crucial. Key Performance Indicators (KPIs) serve as a compass, guiding your strategy, measuring progress, and highlighting areas for improvement. But what exactly are e-commerce KPIs, and how can they drive growth in your online business?
In this article, we’ll break down the importance of e-commerce KPIs, discuss core metrics that every e-commerce owner should track, and explore ways to leverage analytics to optimize business performance.
The Role of KPIs in E-commerce Success
KPIs are quantifiable measurements that provide insights into various aspects of business performance. In e-commerce, KPIs can cover various areas, from traffic and conversion rates to customer retention and order value. They help to identify what’s working, where there may be inefficiencies, and how you can improve overall business outcomes.
For online retailers, a deep understanding of KPIs translates to improved customer experience, better marketing strategies, and ultimately, higher revenue. It’s important to keep in mind that KPIs should be tailored to align with your business objectives. For example, a startup may prioritize metrics like traffic growth and customer acquisition cost, while an established e-commerce business might focus on repeat purchase rates and customer lifetime value (CLTV).
Key E-commerce KPIs You Need to Track
Now, let’s dive into some of the most critical KPIs for online retailers. Each of these metrics provides a different lens into your business operations and can inform specific strategies to improve performance.

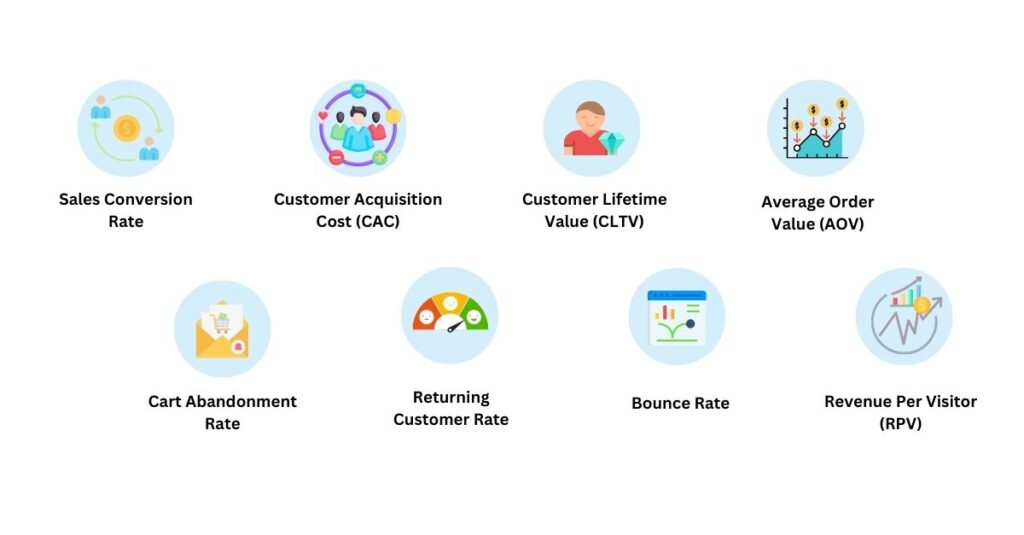
1. Sales Conversion Rate
The sales conversion rate is the percentage of visitors who make a purchase on your website. This KPI is a direct reflection of how well your site is converting potential customers into buyers. A low conversion rate may indicate issues with the user experience, product information, or even pricing.
- How to Calculate: (Number of Sales / Number of Visitors) * 100
- Why It’s Important: Increasing your conversion rate directly impacts your revenue without requiring additional traffic. By optimizing elements like website design, product descriptions, and checkout process, you can boost conversions.
2. Customer Acquisition Cost (CAC)
CAC measures the cost of acquiring a new customer. This KPI includes all marketing and sales expenses, such as advertising costs, campaign spending, and sales team salaries.
- How to Calculate: Total Marketing and Sales Expenses / Number of New Customers Acquired
- Why It’s Important: High CAC can be a warning sign that your marketing efforts aren’t effective. Reducing CAC improves your profit margins and makes customer acquisition more sustainable, which is critical for growth.
3. Customer Lifetime Value (CLTV)
CLTV is the total revenue a business can expect from a single customer throughout their relationship with the company. This metric helps predict future revenue and is a solid indicator of customer loyalty.
- How to Calculate: Average Order Value * Purchase Frequency * Average Customer Lifespan
- Why It’s Important: Understanding CLTV allows you to determine how much you should spend on customer acquisition and retention. Businesses with high CLTV are more resilient, as loyal customers drive steady revenue.
4. Average Order Value (AOV)
AOV indicates the average amount spent per order. Increasing AOV is an effective way to grow revenue without needing to attract new customers.
- How to Calculate: Total Revenue / Number of Orders
- Why It’s Important: Boosting AOV can be achieved through upselling, cross-selling, and offering free shipping for higher-value orders. By enhancing the value of each sale, you can increase revenue with minimal changes to your traffic or customer base.
5. Cart Abandonment Rate
Cart abandonment rate measures the percentage of users who add items to their cart but don’t complete the purchase. A high abandonment rate can signal issues in the checkout process, shipping costs, or payment options.
- How to Calculate: (Number of Abandoned Carts / Number of Shopping Carts Created) * 100
- Why It’s Important: Reducing cart abandonment requires identifying friction points in the checkout process. Streamlining this experience can lead to a significant increase in conversions.
6. Returning Customer Rate
This KPI reveals the percentage of customers who return to your site to make another purchase. It’s an indicator of customer satisfaction and brand loyalty.
- How to Calculate: (Number of Returning Customers / Total Number of Customers) * 100
- Why It’s Important: Retaining existing customers is often more cost-effective than acquiring new ones. A high returning customer rate suggests a positive customer experience and strong brand loyalty.
7. Bounce Rate
The bounce rate indicates the percentage of visitors who leave your website after viewing only one page. A high bounce rate may suggest that visitors aren’t finding what they’re looking for or that there are issues with site usability.
- How to Calculate: (Number of Single-Page Sessions / Total Sessions) * 100
- Why It’s Important: Lowering the bounce rate often involves improving website navigation, speed, and content relevancy, leading to better engagement and potentially higher conversions.
8. Revenue Per Visitor (RPV)
RPV measures the average revenue generated per visitor. This KPI is closely related to conversion rate and AOV but provides a unique insight into overall website effectiveness.
- How to Calculate: Total Revenue / Total Visitors
- Why It’s Important: Monitoring RPV helps you gauge the effectiveness of your marketing efforts and user experience. If your RPV is low, it may be worth testing new strategies for site optimization.
Leveraging Analytics to Optimize E-commerce KPIs
While understanding these KPIs is essential, the true value comes from analyzing trends and applying insights to drive improvements. Here are a few ways to leverage e-commerce analytics to optimize your KPIs.
1. Use Segmentation for Deeper Insights
Segmenting your audience based on factors like purchase behavior, geography, or device usage can reveal unique patterns in each group. This data can help tailor marketing messages, personalize shopping experiences, and even influence product selection to increase conversions.
2. A/B Testing for Continuous Improvement
A/B testing allows you to test different versions of web pages, emails, and ads to see which performs better. For example, if you’re looking to improve your conversion rate, you could test different headlines, images, or call-to-action buttons on product pages. Continuous A/B testing ensures that you’re always optimizing and responding to customer preferences.
3. Track KPIs Over Time
Looking at KPIs on a weekly or monthly basis allows you to identify trends and seasonal changes. Are there particular times of the year when conversion rates spike? Does your bounce rate improve after making site adjustments? Tracking KPIs over time helps pinpoint these trends and keeps you informed about your business’s long-term health.
4. Invest in Predictive Analytics
Predictive analytics use machine learning to anticipate future behaviors based on historical data. In e-commerce, predictive analytics can forecast demand, helping you adjust inventory accordingly, and even anticipate which products a customer is likely to purchase next, improving cross-selling and upselling efforts.
5. Focus on Retention with Customer Feedback
Customer feedback provides invaluable insight into what’s working and what’s not. By understanding why customers leave or stay, you can take action to improve CLTV and return customer rates. Initiating loyalty programs or sending personalized messages based on customer feedback can make a difference in retention.
Conclusion
KPIs are the foundation of a successful e-commerce strategy. By understanding and tracking the right metrics, you gain a clearer picture of your business’s strengths and areas for improvement. While each e-commerce business is unique, monitoring KPIs like conversion rate, CAC, CLTV, and cart abandonment rate will guide you in making smarter, data-driven decisions.
Analytics are your best tool for transforming these KPIs into actionable strategies. Through segmentation, A/B testing, and predictive analytics, you can fine-tune your approach, stay competitive, and drive sustainable growth in a competitive landscape. Remember, continuous improvement in these key metrics means building a healthier, more profitable e-commerce business.


